ディープラーニングで、数値系予測 python版
index:
概要
ディープラーニングの、予測系問題として、温度値の数値予測を検討してみました。
python版で、フレームワークは使用しておりません。
設計については、書籍を参考にしていますので。オリジナル仕様ではありません。
参考の書籍
ゼロから作るDeep Learning /オライリー・ジャパン
ISBN978-4-87311-758-4
https://www.oreilly.co.jp/books/9784873117584/
=>基本的な部分かもしれませんが、勉強になりました。
コード
上記書籍の4章の、比較的シンプルな例を参考にしています
一部のコードのみですが、
興味のある方は、書籍を参考下さい(有償ですが。)
・train.py
学習、パラメータ保存
モデル、ニューロンの数
入力 : 1
隠れ層: 10
出力層 : 1
=> csvファイルから、データ読み込み、学習
# -*- coding: utf-8 -*-
# train/学習処理。結果ファイル保存。
# TwoLayerNet を参考に、3層ネットワーク利用
#  学習 >パラメータ保存

import numpy as np
import pandas as pd
from matplotlib import pyplot as plt
from simple_net import SimpleNet
from util_dt import *
import time

#
if __name__ == '__main__':
    # 学習データ
    rdDim = pd.read_csv("sensors.csv", names=('id', 'temp', 'time') )
    fDim = rdDim["temp"]
    #print(fDim[:10] )
    #quit()
    y_train = np.array(fDim, dtype = np.float32).reshape(len(fDim),1)
    x_train = conv_obj_dtArr(rdDim["time"] )
#    aa = add_date_arr(rdDim, 24 * 10 )
    #add N day
    x_test_pred = add_date_arr(rdDim["time"], 24 * 1 )
    n_train = int(len(x_train) * 0.1 )
    x_test = x_train[ n_train : ]
    y_test = y_train[ n_train : ]
#    x_test_pred =get_pred_dat(x_test, 30 )

    N= len(x_train)
    N_test  =len(x_test )
    num_max_y =100
    y_train =y_train / num_max_y
    y_test  =y_test / num_max_y
    print(x_train.shape, y_train.shape )
    print(x_test.shape  , y_test.shape )
    #quit()
    #
    network = SimpleNet(input_size=1 , hidden_size=10, output_size=1 )
    iters_num = 3000  # 繰り返しの回数を適宜設定する
    train_size = x_train.shape[0]
    print( train_size )
    #
    global_start_time = time.time()

#    batch_size = 100
    batch_size = 32
    learning_rate = 0.1

    train_loss_list = []
    train_acc_list = []
    test_acc_list = []

#    iter_per_epoch = max(train_size / batch_size, 1)
    iter_per_epoch =200
    #print(iter_per_epoch)
    #quit()

    for i in range(iters_num):
        batch_mask = np.random.choice(train_size, batch_size)
        x_batch = x_train[batch_mask]
        t_batch = y_train[batch_mask]

        # 勾配の計算
        grad = network.gradient(x_batch, t_batch)

        # パラメータの更新
        for key in ('W1', 'b1', 'W2', 'b2'):
            network.params[key] -= learning_rate * grad[key]

        loss = network.loss(x_batch, t_batch)
        train_loss_list.append(loss)

        if i % iter_per_epoch == 0:
            train_acc = network.accuracy(x_train, y_train)
            test_acc  = network.accuracy(x_test, y_test)
            train_acc_list.append(train_acc)
            test_acc_list.append(test_acc)
            print("i=" +str(i) + ", train acc, test acc | " + str(train_acc) + ", " + str(test_acc) + " , loss=" +str(loss) )
            print ('time : ', time.time() - global_start_time)
            #print("train acc, test acc | " + str(train_acc) + ", " + str(test_acc))
    #pred
    train_acc = network.accuracy(x_train, y_train)
    test_acc  = network.accuracy(x_test, y_test)
    #
    print("train acc, test acc | " + str(train_acc) + ", " + str(test_acc) + " , loss=" +str(loss) )
    print ('time : ', time.time() - global_start_time)
    #
    # パラメータの保存
    network.save_params("params.pkl")
    print("Saved Network Parameters!")
・評価
predict.py
# -*- coding: utf-8 -*-
# 評価
#

import numpy as np
import pandas as pd
from matplotlib import pyplot as plt
from simple_net import SimpleNet
from util_dt import *
import time
import pickle

#
if __name__ == '__main__':
    # 学習データ
    global_start_time = time.time()
    #
    rdDim = pd.read_csv("sensors.csv", names=('id', 'temp', 'time') )
    fDim = rdDim["temp"]
    y_train = np.array(fDim, dtype = np.float32).reshape(len(fDim),1)
    x_train = conv_obj_dtArr(rdDim["time"] )
    #add N day
    x_test_pred = add_date_arr(rdDim["time"], 24 * 1 )
    n_train = int(len(x_train) * 0.1 )
    x_test = x_train[ n_train : ]
    y_test = y_train[ n_train : ]
    N= len(x_train)
    N_test  =len(x_test )
    num_max_y =100
    y_train =y_train / num_max_y
    y_test  =y_test / num_max_y
    print(x_train.shape, y_train.shape )
    print(x_test.shape  , y_test.shape )
    # load
    network = SimpleNet(input_size=1 , hidden_size=10, output_size=1 )
    network.load_params("params.pkl" )
    #print( network.params["W1"] )
    #pred
    train_acc = network.accuracy(x_train, y_train)
    test_acc  = network.accuracy(x_test, y_test)
    #
    print("train acc, test acc | " + str(train_acc) + ", " + str(test_acc)   )
    #
    x_test_dt= conv_num_date(x_test_pred )
    x_train_dt= conv_num_date(x_train )
    #print(x_test_dt.shape )
    y_val = network.predict(x_test_pred )
    y_train = y_train * num_max_y
    y_val   = y_val * num_max_y
    print ('time : ', time.time() - global_start_time)
    #print(y_val[:10] )
    #print(x_test_dt[:10] )
    #quit()
    #plt
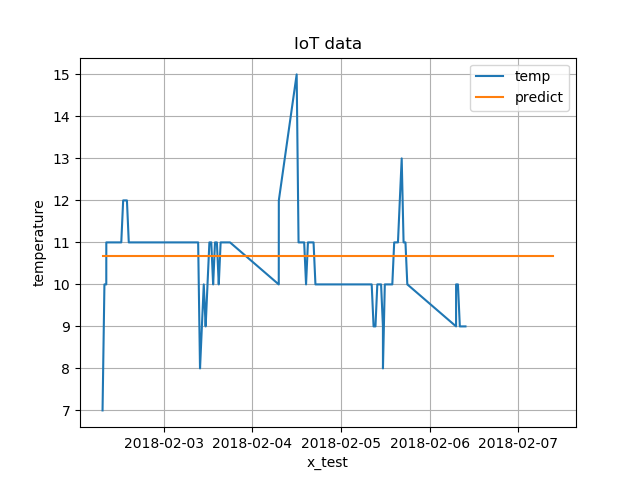
    plt.plot(x_train_dt, y_train, label = "temp")
    plt.plot(x_test_dt , y_val , label = "predict")
    plt.legend()
    plt.grid(True)
    plt.title("IoT data")
    plt.xlabel("x_test")
    plt.ylabel("temperature")
    plt.show()
実行ログ
・学習
1517910051.0
((106, 1), (106, 1))
((96, 1), (96, 1))
106
i=0, train acc, test acc | 1.0, 1.0 , loss=0.04343470078904482
('time : ', 0.004988908767700195)
i=200, train acc, test acc | 1.0, 1.0 , loss=0.0019784747520252997
('time : ', 0.037760019302368164)
i=400, train acc, test acc | 1.0, 1.0 , loss=0.0017000861910257533
('time : ', 0.06999611854553223)
i=600, train acc, test acc | 1.0, 1.0 , loss=0.0018671478595782493
('time : ', 0.10175895690917969)
i=800, train acc, test acc | 1.0, 1.0 , loss=0.0025957290751811744
('time : ', 0.13359308242797852)
i=1000, train acc, test acc | 1.0, 1.0 , loss=0.0021469629579090287
('time : ', 0.1651439666748047)
i=1200, train acc, test acc | 1.0, 1.0 , loss=0.0021951411047292646
('time : ', 0.19913506507873535)
i=1400, train acc, test acc | 1.0, 1.0 , loss=0.0017905553515502502
('time : ', 0.23587608337402344)
i=1600, train acc, test acc | 1.0, 1.0 , loss=0.003246984949423655
('time : ', 0.26787710189819336)
i=1800, train acc, test acc | 1.0, 1.0 , loss=0.0008185550884545171
('time : ', 0.29988908767700195)
i=2000, train acc, test acc | 1.0, 1.0 , loss=0.0007422158728507941
('time : ', 0.3315908908843994)
i=2200, train acc, test acc | 1.0, 1.0 , loss=0.002144580155490773
('time : ', 0.36358094215393066)
i=2400, train acc, test acc | 1.0, 1.0 , loss=0.0006523045260240316
('time : ', 0.39658689498901367)
i=2600, train acc, test acc | 1.0, 1.0 , loss=0.0007984398868557556
('time : ', 0.43489599227905273)
i=2800, train acc, test acc | 1.0, 1.0 , loss=0.0017546652891529933
('time : ', 0.4676520824432373)
train acc, test acc | 1.0, 1.0 , loss=0.0014729059300481405
('time : ', 0.4995899200439453)
Saved Network Parameters!
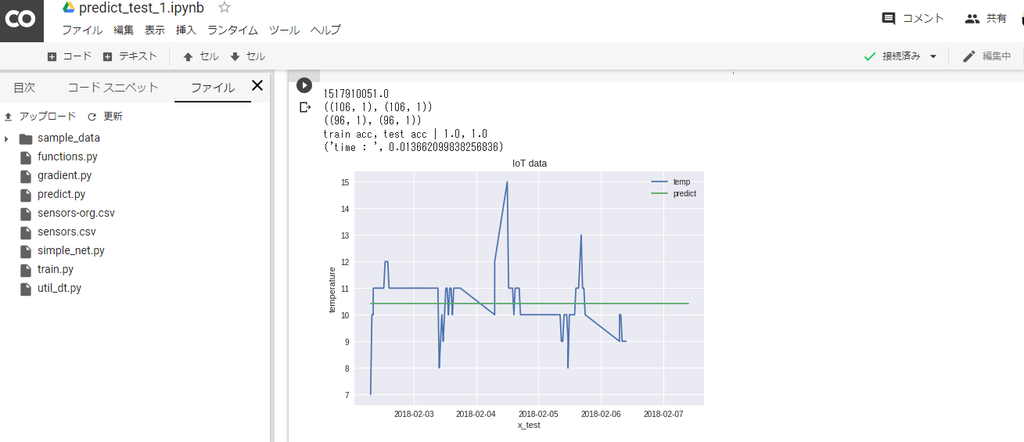
・評価
1517910051.0
((106, 1), (106, 1))
((96, 1), (96, 1))
train acc, test acc | 1.0, 1.0
('time : ', 0.013662099838256836)

