機械学習で、重回帰分析 予測問題
概要
重回帰分析で、複数の変数(説明変数)を含むデータ学習し、予測を出力する例をテストしてみました。
scikit-learn を使用
環境
python 3.5
scikit-learn
numpy
参考の資料
東大さまの、データサイエンス資料を参考にしました。
http://weblab.t.u-tokyo.ac.jp/gci_contents/
コード
csvデータ読み込み、(pandas )
学習データ、テストに分割
モデル定義> 学習
評価
import numpy as np
import numpy.random as random
import scipy as sp
from pandas import Series, DataFrame
import pandas as pd

# 可視化モジュール
import matplotlib.pyplot as plt
import matplotlib as mpl
import seaborn as sns
# 機械学習モジュール
import sklearn

#
# 学習データ
wdata = pd.read_csv("dat_weight.csv"
              ,names=("weight", "height","mid_lenght","top_lenth") )

#print(wdata.head() )
from sklearn.model_selection import train_test_split

# モデル
from sklearn import linear_model

# モデルのインスタンス
l_model = linear_model.LinearRegression()

# 説明変数に "xx" 以外を利用
X = wdata.drop("weight", axis=1)

print(X.shape )
#print(X[:10 ] )
#quit()
#print( type( X) )
#print(X[: 10 ] )

# 目的変数
Y = wdata["weight"]
# 学習データとテストデータに分ける
X_train, X_test, y_train, y_test = train_test_split(X, Y, test_size=0.25 ,random_state=0)
print(X_train.shape , y_train.shape  )
print(X_test.shape , y_test.shape  )
#print( type( X_test ) )
#quit()

# fit
clf = l_model.fit(X_train,y_train)
print("train:",clf.__class__.__name__ ,clf.score(X_train,y_train))
print("test:",clf.__class__.__name__ , clf.score(X_test,y_test))

# 偏回帰係数
print(pd.DataFrame({"Name":X.columns,
                    "Coefficients":clf.coef_}).sort_values(by='Coefficients') )

# 切片
print(clf.intercept_)
#quit()

#predict
#tdat =X_test[1: 2]
tdat =X_test[0: 5 ]
#print(tdat )
pred = l_model.predict(tdat )
#print(pred.shape )
print(pred )
#print(pred[: 10])
quit()
実行、評価
(50, 3)
(37, 3) (37,)
(13, 3) (13,)
train: LinearRegression 0.47236561361359364
test: LinearRegression 0.30795876365763886
   Coefficients        Name
1      0.125665  mid_lenght
2      0.187075   top_lenth
0      0.600082      height
-54.72694773189494
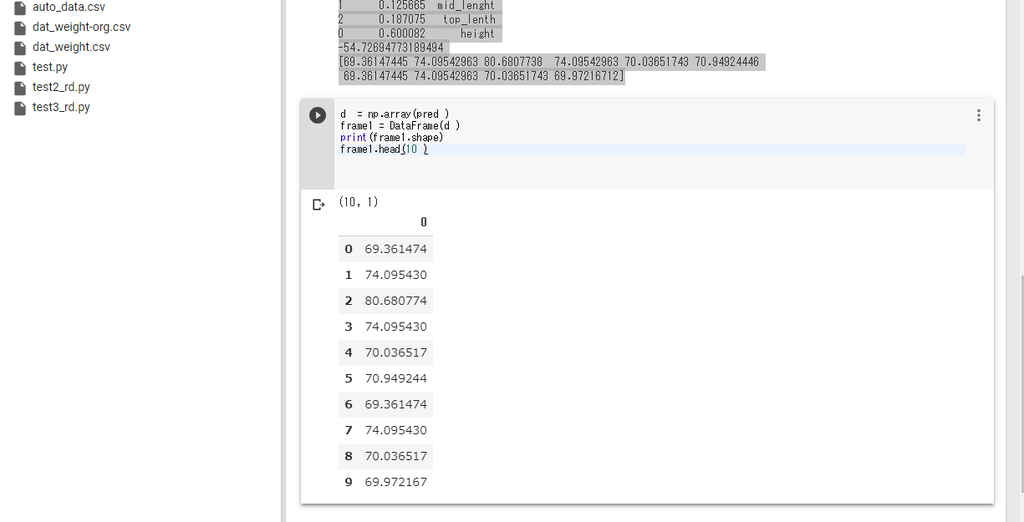
[69.36147445 74.09542963 80.6807738  74.09542963 70.03651743 70.94924446
 69.36147445 74.09542963 70.03651743 69.97216712]
データ件数が、少なかったり。
精度は、低めでした、
・テストデータの先頭の、N人の体重。
pd.DataFrame

