matplotlib plot()
index:
概要
データの可視化で、matplotlibの機能の説明になります
参考のページ / tutorial:
必要なimport
#
import numpy as np
import numpy.random as random
import scipy as sp

import matplotlib.pyplot as plt
import matplotlib as mpl
import seaborn as sns
plot()
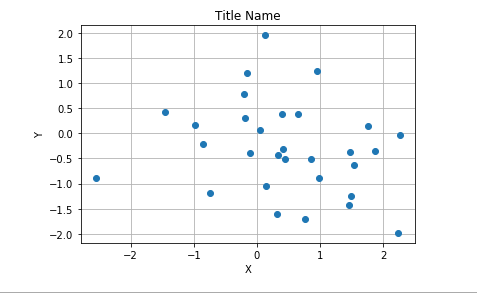
Line plot
#  plot
import numpy.random as random

# シード値の固定
random.seed(0)
x = np.random.randn(30)
y =  np.random.randn(30)
# plot
plt.plot(x, y, "o")

# title
plt.title("Title Name")
# Xの座標名
plt.xlabel("X")
# Yの座標名
plt.ylabel("Y")
# gridの表示
plt.grid(True)
plot + sin 波形
#
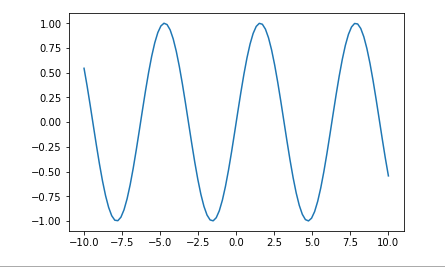
x = np.linspace(-10, 10,100)
plt.plot(x, np.sin(x))
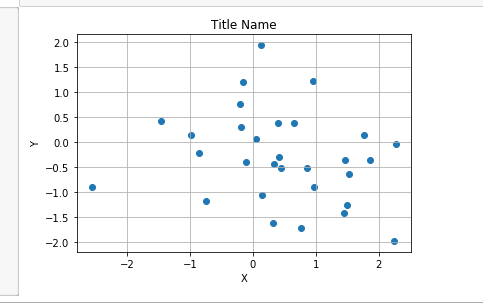
散布図
scatter()
#
import numpy.random as random

# シード値の固定
random.seed(0)
# x軸のデータ
x = np.random.randn(30)
# y軸のデータ
y =  np.random.randn(30)
plt.scatter(x, y)

# title
plt.title("Title Name")
# Xの座標名
plt.xlabel("X")
# Yの座標名
plt.ylabel("Y")
# gridの表示
plt.grid(True)
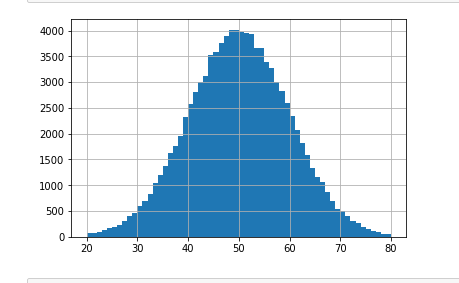
hist()
# histogram
random.seed(0)
plt.hist(np.random.randn(10**5)*10 + 50, bins=60,range=(20,80))
plt.grid(True)
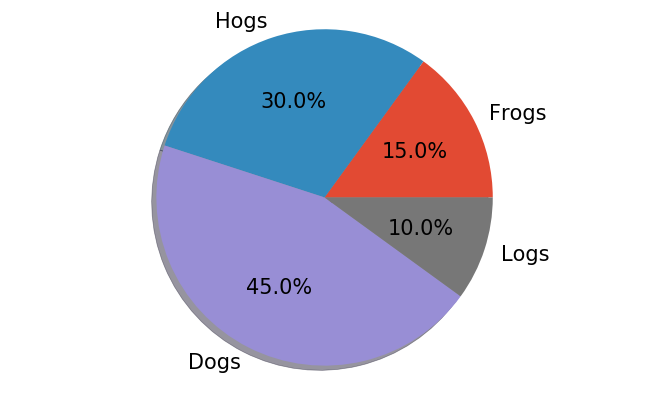
pie()
円グラフ
#
labels = 'Frogs', 'Hogs', 'Dogs', 'Logs'
fracs = [15, 30, 45, 10]
size=(9,5)
plt.figure(figsize=size,dpi=100)
plt.pie(fracs, labels=labels, autopct='%1.1f%%', shadow=True)
plt.subplots_adjust(left=0,right=0.7)
plt.axis('equal')
