ディープラーニングで、kaggle タイタニック問題に挑戦。
index:
学習データ
kaggle の上記ページから、
学習データ等を、コピーします。
・目的変数:
Survived :生存したかどうか。
testデータは、Survivedが、含まれないので注意です。
・説明変数:
年齢、性別など
結果
先に結果となりますが。
78.46%
前回よりは、少しスコア上昇しましたが。まだまだですね

コード
ニューロンの数
入力: 5(説明変数 の数)
隠れ層:10
出力層:2
import numpy as np
import numpy.random as random
import scipy as sp
from pandas import Series, DataFrame
import pandas as pd
import time
# 可視化モジュール
import matplotlib.pyplot as plt
import matplotlib as mpl
# 機械学習モジュール
import sklearn
from keras.utils import np_utils
from class_net import ClassNet

#
def get_subData(src ):
    sub=src
    sub["Age"] = src["Age"].fillna( src["Age"].median())
    sub = sub.dropna()
#    sub["Embark_flg"] = sub["Embarked"].values
    sub["Embark_flg"] = sub["Embarked"]
    sub["Embark_flg"] = sub["Embark_flg"].map(lambda x: str(x).replace('C', '0') )
    sub["Embark_flg"] = sub["Embark_flg"].map(lambda x: str(x).replace('Q', '1') )
    sub["Embark_flg"] = sub["Embark_flg"].map(lambda x: str(x).replace('S', '2') )
    sub.groupby("Embark_flg").size()
    # convert, num
    sub = sub.assign( Embark_flg=pd.to_numeric( sub.Embark_flg ))
    sub["Sex_flg"] = sub["Sex"].map(lambda x: 0 if x =='female' else 1)
    return sub

# 標準化対応、学習。
# 学習データ
train_data = pd.read_csv("train.csv" )
test_data = pd.read_csv("test.csv" )
print( train_data.shape )
#print( train_data.head() )
#
# 前処理 ,欠損データ 中央値で置き換える
train2  = train_data[["PassengerId","Survived","Sex","Age" , "Embarked" ,"SibSp" ,"Parch" ]]
test2   = test_data[ ["PassengerId"           ,"Sex","Age" , "Embarked" ,"SibSp" ,"Parch" ]]
#
age_mid=train2["Age"].median()
#print(age_mid )
print(train2.info() )
print(train2.head(10 ) )
#train2 = train2.dropna()
#train2["Embark_flg"] = train2["Embarked"].map(lambda x: str(x).replace('C', '0') )

train_sub =get_subData(train2 )
test_sub =get_subData(test2 )
print(train_sub.info() )
print(test_sub.info() )
#quit()

# 説明変数と目的変数
x_train= train_sub[["Sex_flg","Age" , "Embark_flg" ,"SibSp" ,"Parch" ]]
y_train= train_sub['Survived']
x_test = test_sub[["Sex_flg","Age" , "Embark_flg" ,"SibSp" ,"Parch" ]]

#conv
num_max_y=10
colmax_x =x_train[ "Age" ].max()
#x_train = x_train / colmax_x
#print(x_train[: 10 ])
#quit()

#print("#check-df")
#col_name="Age"
#print(x_train[ col_name ].max() )
#print(x_train[ col_name ].min() )
#quit()
#np
x_train = np.array(x_train, dtype = np.float32).reshape(len(x_train), 5)
y_train = np.array(y_train, dtype = np.float32).reshape(len(y_train), 1)
#正解ラベルをOne-Hot表現に変換
#y_train = y_train / num_max_y
#x_test  = x_test / num_max_y
y_train=np_utils.to_categorical(y_train, 2)

#


# 学習データとテストデータに分ける
print(x_train.shape, y_train.shape )
print(x_test.shape  )
#print( y_train[: 10 ])
#print(type(x_train) )
#quit()
#
# ClassNet
#network = SimpleNet(input_size=1 , hidden_size=10, output_size=1 )
global_start_time = time.time()
network = ClassNet(input_size=5 , hidden_size=10, output_size=2 )

#iters_num = 5000  # 繰り返しの回数を適宜設定する
iters_num = 10000  # 繰り返しの回数を適宜設定する
train_size = x_train.shape[0]
print( train_size )
#quit()
#
global_start_time = time.time()

#    batch_size = 100
batch_size = 32
learning_rate = 0.1

train_loss_list = []
train_acc_list = []
test_acc_list = []

#    iter_per_epoch = max(train_size / batch_size, 1)
iter_per_epoch =1000
#print(iter_per_epoch)
#quit()

for i in range(iters_num):
    batch_mask = np.random.choice(train_size, batch_size)
    x_batch = x_train[batch_mask]
#    quit()
    t_batch = y_train[batch_mask]

    # 勾配の計算
    grad = network.gradient(x_batch, t_batch)

    # パラメータの更新
    for key in ('W1', 'b1', 'W2', 'b2'):
        network.params[key] -= learning_rate * grad[key]

    loss = network.loss(x_batch, t_batch)
    train_loss_list.append(loss)

    if i % iter_per_epoch == 0:
        train_acc = network.accuracy(x_train, y_train)
#        test_acc  = network.accuracy(x_test, y_test)
        train_acc_list.append(train_acc)
        #test_acc_list.append(test_acc)
        #print("i=" +str(i) + ", train acc, test acc | " + str(train_acc) + ", " + str(test_acc) + " , loss=" +str(loss) )
        print("i=" +str(i) + ", train acc | " + str(train_acc) + " , loss=" +str(loss) )
        print ('time : ', time.time() - global_start_time)
        #print("train acc, test acc | " + str(train_acc) + ", " + str(test_acc))
#pred
train_acc = network.accuracy(x_train, y_train)
#test_acc  = network.accuracy(x_test, y_test)
#
#print("train acc, test acc | " + str(train_acc) + ", " + str(test_acc) + " , loss=" +str(loss) )
print("train acc | " + str(train_acc) +  " , loss=" +str(loss) )
print ('time : ', time.time() - global_start_time)
#
# パラメータの保存
network.save_params("params.pkl")
print("Saved Network Parameters!")

#print(train_acc_list[: 10])
#quit()
#plt
a1=np.arange(len(train_acc_list) )
#plt.plot(a1 , y_test *num_max_y , label = "y_test")
plt.plot(a1 , train_acc_list , label = "predict")
plt.legend()
plt.grid(True)
plt.title("price pred")
plt.xlabel("x")
plt.ylabel("price")
plt.show()
評価
# load
#network = SimpleNet(input_size=1 , hidden_size=10, output_size=1 )
network = ClassNet(input_size=5 , hidden_size=10, output_size=2 )
network.load_params("params.pkl" )


train_acc = network.accuracy(x_train, y_train)
#test_acc  = network.accuracy(x_test, y_test)
#
#print("train acc | " + str(train_acc) +  " , loss=" +str(loss) )
print("train acc | " + str(train_acc) )
print ('time : ', time.time() - global_start_time)

#
# 予測をしてCSVへ書き出す
pred = network.predict( x_test)
print(pred.shape )
outList=[]
for item in pred:
    y = np.argmax(item )
    outList.append(y )

#print(outList[: 10])
pred_y= np.array( outList )
#quit()

PassengerId = np.array( test_data["PassengerId"]).astype(int)
#df = pd.DataFrame(outList , PassengerId, columns=["Survived"])
df = pd.DataFrame(pred_y , PassengerId, columns=["Survived"])
df.head()

#
df.to_csv("out2.csv", index_label=["PassengerId"])
ディープラーニングで、予測問題 家賃の予測
index:
学習データ
・目的変数
家賃
・説明変数
敷金、築年数 など。
コード
ニューロンの数
入力: 5(説明変数 の数)
隠れ層:10
出力層:1
import numpy as np
import pandas as pd
from pandas import Series, DataFrame
from sklearn.model_selection import train_test_split
from matplotlib import pyplot as plt
from simple_net import SimpleNet
from util_dt import *
from util_df import *
import time

#
# 学習データ
# 学習データ
global_start_time = time.time()
wdata = pd.read_csv("data.csv" )
wdata.columns =["no", "price","siki_price", "rei_price" ,"menseki" ,"nensu" ,"toho" ,"madori" ,"houi" ,"kouzou" ]
#print(wdata.head() )
#quit()

# conv=> num
sub_data = wdata[[ "no","price","siki_price", "rei_price" ,"menseki" ,"nensu" ,"toho" ] ]
sub_data = sub_data.assign(price=pd.to_numeric( sub_data.price))
print( sub_data.head() )
print(sub_data["price"][: 10])

# 説明変数に "price" 以外を利用
X = sub_data.drop("price", axis=1)
X = X.drop("no", axis=1)

#num_max_x= 10
num_max_x= 1000
X = (X / num_max_x )
print(X.head() )
print(X.shape )
#print( type( X) )
#print(X[: 10 ] )

# 目的変数
num_max_y= num_max_x
Y = sub_data["price"]
Y = Y / num_max_y
print(Y.max() )
print(Y.min() )
#quit()

# 学習データとテストデータに分ける
x_train, x_test, y_train, y_test = train_test_split(X, Y, test_size=0.25 ,random_state=0)
#x_train_sub =x_train
#x_test_sub  =x_test
#x_train = x_train["x_dat"]
#x_test = x_test["x_dat"]
#print(type(x_train) )
#quit()
x_train =np.array(x_train, dtype = np.float32).reshape(len(x_train), 5)
y_train =np.array(y_train, dtype = np.float32).reshape(len(y_train), 1)
x_test  =np.array(x_test, dtype  = np.float32).reshape(len(x_test), 5 )
y_test =np.array(y_test, dtype   = np.float32).reshape(len(y_test), 1)
#
#x_train =np.array(x_train, dtype = np.float64 ).reshape(len(x_train), 5)
#y_train =np.array(y_train, dtype = np.float64).reshape(len(y_train), 1)
#x_test  =np.array(x_test, dtype  = np.float64).reshape(len(x_test), 5 )
#y_test =np.array(y_test, dtype   = np.float64).reshape(len(y_test), 1)

print( x_train.shape , y_train.shape  )
print( x_test.shape  , y_test.shape  )
#print(x_train[: 10])
#print(type(x_train ))
#quit()
#
network = SimpleNet(input_size=5 , hidden_size=10, output_size=1 )

#iters_num = 30000  # 繰り返しの回数を適宜設定する
iters_num = 10000  # 繰り返しの回数を適宜設定する

train_size = x_train.shape[0]
print( train_size )
#quit()

#
global_start_time = time.time()

#batch_size = 100
#batch_size = 32
batch_size = 16
learning_rate = 0.1

train_loss_list = []
train_acc_list = []
test_acc_list = []
#
#iter_per_epoch =200
iter_per_epoch = 500

#print(iter_per_epoch)
#quit()

for i in range(iters_num):
    batch_mask = np.random.choice(train_size, batch_size)
    #print(batch_mask )
    x_batch = x_train[batch_mask]
    t_batch = y_train[batch_mask]
    #quit()s
    # 勾配の計算
    grad = network.gradient(x_batch, t_batch)

    # パラメータの更新
    for key in ('W1', 'b1', 'W2', 'b2'):
        network.params[key] -= learning_rate * grad[key]

    loss = network.loss(x_batch, t_batch)
    train_loss_list.append(loss)

    if i % iter_per_epoch == 0:
        print ("i=" +str(i) + ', time : '+ str( time.time() - global_start_time) + " , loss=" +str(loss))

#print("train acc, test acc | " + str(train_acc) + ", " + str(test_acc) + " , loss=" +str(loss) )
print ('time : ', time.time() - global_start_time)
#
# パラメータの保存
network.save_params("params.pkl")
print("Saved Network Parameters!")
#quit()

#pred
y_test_div=y_test[: 10] * num_max_y
#print( y_test_div )
print( y_test_div )
y_val = network.predict(x_test[: 10])
y_val = y_val * num_max_y
print( y_val )
評価
・予測した、先頭数件の家賃

・テストデータ家賃と、予測した家賃の比較
折れ線グラフ

機械学習で、kaggle タイタニック問題に挑戦
index:
概要
初心者問題らしい kaggle Competition のタイタニック問題を実施してみました。
https://www.kaggle.com/c/titanic
今回は、ロジスティック回帰で進める事にしてみました。
環境
python 3.5
scikit-learn
numpy
matplotlib
学習データ
kaggle の上記ページから、
学習データ等を、コピーします。
train.csv
test.csv
目的変数:
Survived :生存したかどうか。
testデータは、Survivedが、含まれないので注意です。
説明変数:
年齢、性別など
結果
先に、今回の結果を添付しておきます。
正解率 約、77.03%
上記コンペのページの[ Submit predictions]
から、結果ファイルをアップすると、
結果が表示されました。低いですね、、
=>上位は、90%超えているようで、改善が必要なようです

処理
一部分ですが、
csvデータを読み込み、
前処理、欠損データの変換
数値以外データの変換処理など
学習
評価
=> テストデータは、目的変数(Survived) が無いので
正解率は出力できず、提出用CSVに、
予測値を出力しておきます
# 標準化対応、学習。
# 学習データ
train_data = pd.read_csv("train.csv" )
test_data = pd.read_csv("test.csv" )
print( train_data.shape )
#print( train_data.head() )
#
# 前処理 ,欠損データ 中央値で置き換える
train2  = train_data[["PassengerId","Survived","Sex","Age" , "Embarked" ,"SibSp" ,"Parch" ]]
test2   = test_data[ ["PassengerId","Sex","Age" , "Embarked" ,"SibSp" ,"Parch" ]]

train_sub =get_subData(train2 )
test_sub =get_subData(test2 )
print(train_sub.info() )
print(test_sub.info() )
#quit()

# ロジスティック回帰
from sklearn.linear_model import LogisticRegression

# 説明変数と目的変数
X_train= train_sub[["Sex_flg","Age" , "Embark_flg" ,"SibSp" ,"Parch" ]]
y_train= train_sub['Survived']
X_test = test_sub[["Sex_flg","Age" , "Embark_flg" ,"SibSp" ,"Parch" ]]

# 学習データとテストデータに分ける
print(X_train.shape, y_train.shape )
print(X_test.shape  )
#quit()

# ロジスティック回帰のインスタンス
model = LogisticRegression()

# fit
clf = model.fit(X_train,y_train)

print("train result:",clf.score(X_train,y_train))
#quit()
#
# 予測をしてCSVへ書き出す
pred = model.predict(X_test)
PassengerId = np.array( test_data["PassengerId"]).astype(int)
df = pd.DataFrame(pred, PassengerId, columns=["Survived"])
df.head()

#
df.to_csv("out_res.csv", index_label=["PassengerId"])
関連のコード
まとめ
正解率を上げられるように、
改良点を検討したいと思います
機械学習で、ロジスティック回帰 予測問題
index:
概要
前回の重回帰分析と異なり、
目的変数が、連続した値ではなく
予測したい変数が連続数値ではなく、2種類の選択(購入する /しない)の場合
を考えます。
環境
python 3.5
scikit-learn
numpy
matplotlib
参考の資料
東大さまの、データサイエンス資料を参考にしました。
http://weblab.t.u-tokyo.ac.jp/gci_contents/
学習データ
特定の人の、収入に関するデータ
目的変数:
その人の収入が50K(5万ドル)を超えるかどうか
の判定
説明変数:
年齢、職業、性別など
adult_data.info() で、中身をみておきます
<class 'pandas.core.frame.DataFrame'>
RangeIndex: 32561 entries, 0 to 32560
Data columns (total 15 columns):
age               32561 non-null int64
workclass         32561 non-null object
fnlwgt            32561 non-null int64
education         32561 non-null object
education-num     32561 non-null int64
marital-status    32561 non-null object
occupation        32561 non-null object
relationship      32561 non-null object
race              32561 non-null object
sex               32561 non-null object
capital-gain      32561 non-null int64
capital-loss      32561 non-null int64
hours-per-week    32561 non-null int64
native-country    32561 non-null object
flg-50K           32561 non-null object
dtypes: int64(6), object(9)
memory usage: 3.7+ MB
コード
データ読み込み、pandas
目的変数:flg立てをする
学習、
評価
・標準化 を、行った場合の例です
import numpy as np
import numpy.random as random
import scipy as sp
from pandas import Series, DataFrame
import pandas as pd

# 可視化モジュール
import matplotlib.pyplot as plt
import matplotlib as mpl
#%matplotlib inline
# 機械学習モジュール
import sklearn

# 標準化対応、学習。
# 学習データ
adult_data = pd.read_csv("dat_money.csv" )
print(adult_data.head( ))

#
adult_data.info()
#
adult_data.groupby("flg-50K").size()
#
# 目的変数:flg立てをする
adult_data["fin_flg"] = adult_data["flg-50K"].map(lambda x: 1 if x ==' >50K' else 0)

#
adult_data.groupby("fin_flg").size()

#
# ロジスティック回帰
from sklearn.linear_model import LogisticRegression
from sklearn.model_selection import train_test_split

# 標準化のためのモジュール
from sklearn.preprocessing import StandardScaler

# 説明変数と目的変数
X = adult_data[["age","fnlwgt","education-num","capital-gain","capital-loss"]]
Y = adult_data['fin_flg']

# 学習データとテストデータに分ける
X_train, X_test, y_train, y_test = train_test_split(X,Y,random_state=0)

# ロジスティック回帰
model = LogisticRegression()

# 標準化
sc = StandardScaler()
sc.fit(X_train)
X_train_std = sc.transform(X_train)
X_test_std  = sc.transform(X_test)

clf = model.fit(X_train_std,y_train)
print("train:",clf.score(X_train_std,y_train))
print("test:", clf.score(X_test_std,y_test))

print(clf.coef_ )
#
pred= model.predict(X_test_std[:10])
print(pred )
github
github.com
python3 です。
実行
テストデータは、80.9% 程の正解
となりました。
train: 0.810483210483
test: 0.809974204643
・先頭の数件テスト、収入判定/ 予測

機械学習で、重回帰分析(2) 家賃を予測する
index:
概要
前回の重回帰分析の続編とり、
家賃の予測機能を検証したいと、思います。
不動産の物件情報を学習し、特定の物件の家賃を予測
scikit-learn を使用
・前回と、機械学習の流れは同じで、学習データは、
今回は、家賃に関係するデータとなります
コード
csvデータを読み込み、学習
評価
import numpy as np
import numpy.random as random
import scipy as sp
from pandas import Series, DataFrame
import pandas as pd

# 可視化モジュール
import matplotlib.pyplot as plt
import matplotlib as mpl
import seaborn as sns
# 機械学習モジュール
import sklearn

#
# 学習データ
wdata = pd.read_csv("data.csv" )
#wdata.columns =["no","addr","price","siki_price", "rei_price" ,"menseki" ,"nensu" ,"toho" ,"madori" ,"houi" ,"kouzou" ]
wdata.columns =["no", "price","siki_price", "rei_price" ,"menseki" ,"nensu" ,"toho" ,"madori" ,"houi" ,"kouzou" ]
print(wdata.head() )
#print(wdata["NO"][: 10 ] )

# conv=> num
sub_data = wdata[[ "no","price","siki_price", "rei_price" ,"menseki" ,"nensu" ,"toho" ] ]
sub_data = sub_data.assign(price=pd.to_numeric( sub_data.price))

print(sub_data["price"][: 10])
##quit()

#
# データの分割(学習データとテストデータに分ける)
# sklearnのバージョンによっては train_test_splitはsklearn.cross_validationにしか入ってない場合があります
from sklearn.model_selection import train_test_split

# モデル
from sklearn import linear_model

# モデルのインスタンス
l_model = linear_model.LinearRegression()

# 説明変数に "price" 以外を利用
X = sub_data.drop("price", axis=1)

print(X.shape )
#print( type( X) )
#print(X[: 10 ] )
# 目的変数
Y = sub_data["price"]

# 学習データとテストデータに分ける
X_train, X_test, y_train, y_test = train_test_split(X, Y, test_size=0.25 ,random_state=0)
print(X_train.shape , y_train.shape  )
print(X_test.shape , y_test.shape  )
#print( type( X_test ) )
#quit()

# fit
clf = l_model.fit(X_train,y_train)
print("train:",clf.__class__.__name__ ,clf.score(X_train,y_train))
print("test:",clf.__class__.__name__ , clf.score(X_test,y_test))

# 偏回帰係数
print(pd.DataFrame({"Name":X.columns,
                    "Coefficients":clf.coef_}).sort_values(by='Coefficients') )

# 切片
print(clf.intercept_)
#quit()

#predict
#tdat =X_test[1: 2]
tdat =X_test[0: 5 ]
#print(tdat )
pred = l_model.predict(tdat )
#print(pred.shape )
print(pred )
評価
・テストデータの先頭の、数件の家賃(予測)
DataFrame

・テストデータ、予測(家賃)の比較 のグラフ

機械学習で、重回帰分析 予測問題
概要
重回帰分析で、複数の変数(説明変数)を含むデータ学習し、予測を出力する例をテストしてみました。
scikit-learn を使用
環境
python 3.5
scikit-learn
numpy
参考の資料
東大さまの、データサイエンス資料を参考にしました。
http://weblab.t.u-tokyo.ac.jp/gci_contents/
コード
csvデータ読み込み、(pandas )
学習データ、テストに分割
モデル定義> 学習
評価
import numpy as np
import numpy.random as random
import scipy as sp
from pandas import Series, DataFrame
import pandas as pd

# 可視化モジュール
import matplotlib.pyplot as plt
import matplotlib as mpl
import seaborn as sns
# 機械学習モジュール
import sklearn

#
# 学習データ
wdata = pd.read_csv("dat_weight.csv"
              ,names=("weight", "height","mid_lenght","top_lenth") )

#print(wdata.head() )
from sklearn.model_selection import train_test_split

# モデル
from sklearn import linear_model

# モデルのインスタンス
l_model = linear_model.LinearRegression()

# 説明変数に "xx" 以外を利用
X = wdata.drop("weight", axis=1)

print(X.shape )
#print(X[:10 ] )
#quit()
#print( type( X) )
#print(X[: 10 ] )

# 目的変数
Y = wdata["weight"]
# 学習データとテストデータに分ける
X_train, X_test, y_train, y_test = train_test_split(X, Y, test_size=0.25 ,random_state=0)
print(X_train.shape , y_train.shape  )
print(X_test.shape , y_test.shape  )
#print( type( X_test ) )
#quit()

# fit
clf = l_model.fit(X_train,y_train)
print("train:",clf.__class__.__name__ ,clf.score(X_train,y_train))
print("test:",clf.__class__.__name__ , clf.score(X_test,y_test))

# 偏回帰係数
print(pd.DataFrame({"Name":X.columns,
                    "Coefficients":clf.coef_}).sort_values(by='Coefficients') )

# 切片
print(clf.intercept_)
#quit()

#predict
#tdat =X_test[1: 2]
tdat =X_test[0: 5 ]
#print(tdat )
pred = l_model.predict(tdat )
#print(pred.shape )
print(pred )
#print(pred[: 10])
quit()
実行、評価
(50, 3)
(37, 3) (37,)
(13, 3) (13,)
train: LinearRegression 0.47236561361359364
test: LinearRegression 0.30795876365763886
   Coefficients        Name
1      0.125665  mid_lenght
2      0.187075   top_lenth
0      0.600082      height
-54.72694773189494
[69.36147445 74.09542963 80.6807738  74.09542963 70.03651743 70.94924446
 69.36147445 74.09542963 70.03651743 69.97216712]
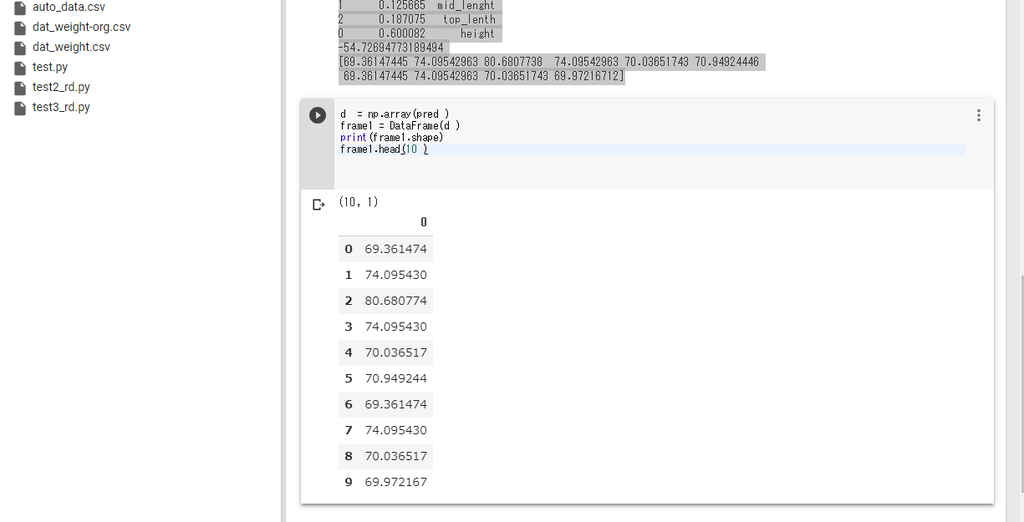
データ件数が、少なかったり。
精度は、低めでした、
・テストデータの先頭の、N人の体重。
pd.DataFrame

ディープラーニングで、数値系予測 python版
index:
概要
ディープラーニングの、予測系問題として、温度値の数値予測を検討してみました。
python版で、フレームワークは使用しておりません。
設計については、書籍を参考にしていますので。オリジナル仕様ではありません。
参考の書籍
ゼロから作るDeep Learning /オライリー・ジャパン
ISBN978-4-87311-758-4
https://www.oreilly.co.jp/books/9784873117584/
=>基本的な部分かもしれませんが、勉強になりました。
コード
上記書籍の4章の、比較的シンプルな例を参考にしています
一部のコードのみですが、
興味のある方は、書籍を参考下さい(有償ですが。)
・train.py
学習、パラメータ保存
モデル、ニューロンの数
入力 : 1
隠れ層: 10
出力層 : 1
=> csvファイルから、データ読み込み、学習
# -*- coding: utf-8 -*-
# train/学習処理。結果ファイル保存。
# TwoLayerNet を参考に、3層ネットワーク利用
#  学習 >パラメータ保存

import numpy as np
import pandas as pd
from matplotlib import pyplot as plt
from simple_net import SimpleNet
from util_dt import *
import time

#
if __name__ == '__main__':
    # 学習データ
    rdDim = pd.read_csv("sensors.csv", names=('id', 'temp', 'time') )
    fDim = rdDim["temp"]
    #print(fDim[:10] )
    #quit()
    y_train = np.array(fDim, dtype = np.float32).reshape(len(fDim),1)
    x_train = conv_obj_dtArr(rdDim["time"] )
#    aa = add_date_arr(rdDim, 24 * 10 )
    #add N day
    x_test_pred = add_date_arr(rdDim["time"], 24 * 1 )
    n_train = int(len(x_train) * 0.1 )
    x_test = x_train[ n_train : ]
    y_test = y_train[ n_train : ]
#    x_test_pred =get_pred_dat(x_test, 30 )

    N= len(x_train)
    N_test  =len(x_test )
    num_max_y =100
    y_train =y_train / num_max_y
    y_test  =y_test / num_max_y
    print(x_train.shape, y_train.shape )
    print(x_test.shape  , y_test.shape )
    #quit()
    #
    network = SimpleNet(input_size=1 , hidden_size=10, output_size=1 )
    iters_num = 3000  # 繰り返しの回数を適宜設定する
    train_size = x_train.shape[0]
    print( train_size )
    #
    global_start_time = time.time()

#    batch_size = 100
    batch_size = 32
    learning_rate = 0.1

    train_loss_list = []
    train_acc_list = []
    test_acc_list = []

#    iter_per_epoch = max(train_size / batch_size, 1)
    iter_per_epoch =200
    #print(iter_per_epoch)
    #quit()

    for i in range(iters_num):
        batch_mask = np.random.choice(train_size, batch_size)
        x_batch = x_train[batch_mask]
        t_batch = y_train[batch_mask]

        # 勾配の計算
        grad = network.gradient(x_batch, t_batch)

        # パラメータの更新
        for key in ('W1', 'b1', 'W2', 'b2'):
            network.params[key] -= learning_rate * grad[key]

        loss = network.loss(x_batch, t_batch)
        train_loss_list.append(loss)

        if i % iter_per_epoch == 0:
            train_acc = network.accuracy(x_train, y_train)
            test_acc  = network.accuracy(x_test, y_test)
            train_acc_list.append(train_acc)
            test_acc_list.append(test_acc)
            print("i=" +str(i) + ", train acc, test acc | " + str(train_acc) + ", " + str(test_acc) + " , loss=" +str(loss) )
            print ('time : ', time.time() - global_start_time)
            #print("train acc, test acc | " + str(train_acc) + ", " + str(test_acc))
    #pred
    train_acc = network.accuracy(x_train, y_train)
    test_acc  = network.accuracy(x_test, y_test)
    #
    print("train acc, test acc | " + str(train_acc) + ", " + str(test_acc) + " , loss=" +str(loss) )
    print ('time : ', time.time() - global_start_time)
    #
    # パラメータの保存
    network.save_params("params.pkl")
    print("Saved Network Parameters!")
・評価
predict.py
# -*- coding: utf-8 -*-
# 評価
#

import numpy as np
import pandas as pd
from matplotlib import pyplot as plt
from simple_net import SimpleNet
from util_dt import *
import time
import pickle

#
if __name__ == '__main__':
    # 学習データ
    global_start_time = time.time()
    #
    rdDim = pd.read_csv("sensors.csv", names=('id', 'temp', 'time') )
    fDim = rdDim["temp"]
    y_train = np.array(fDim, dtype = np.float32).reshape(len(fDim),1)
    x_train = conv_obj_dtArr(rdDim["time"] )
    #add N day
    x_test_pred = add_date_arr(rdDim["time"], 24 * 1 )
    n_train = int(len(x_train) * 0.1 )
    x_test = x_train[ n_train : ]
    y_test = y_train[ n_train : ]
    N= len(x_train)
    N_test  =len(x_test )
    num_max_y =100
    y_train =y_train / num_max_y
    y_test  =y_test / num_max_y
    print(x_train.shape, y_train.shape )
    print(x_test.shape  , y_test.shape )
    # load
    network = SimpleNet(input_size=1 , hidden_size=10, output_size=1 )
    network.load_params("params.pkl" )
    #print( network.params["W1"] )
    #pred
    train_acc = network.accuracy(x_train, y_train)
    test_acc  = network.accuracy(x_test, y_test)
    #
    print("train acc, test acc | " + str(train_acc) + ", " + str(test_acc)   )
    #
    x_test_dt= conv_num_date(x_test_pred )
    x_train_dt= conv_num_date(x_train )
    #print(x_test_dt.shape )
    y_val = network.predict(x_test_pred )
    y_train = y_train * num_max_y
    y_val   = y_val * num_max_y
    print ('time : ', time.time() - global_start_time)
    #print(y_val[:10] )
    #print(x_test_dt[:10] )
    #quit()
    #plt
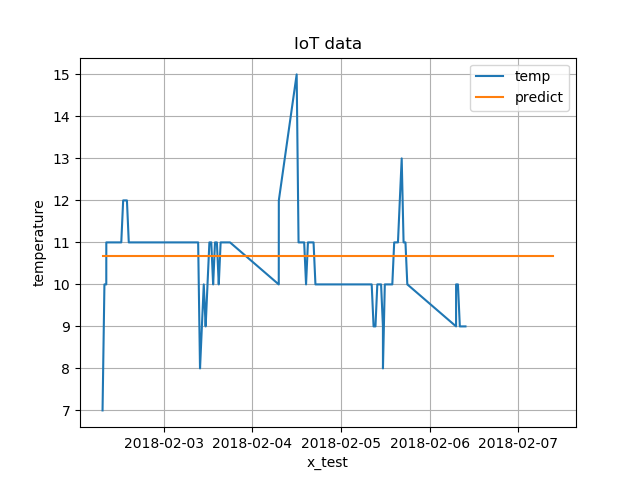
    plt.plot(x_train_dt, y_train, label = "temp")
    plt.plot(x_test_dt , y_val , label = "predict")
    plt.legend()
    plt.grid(True)
    plt.title("IoT data")
    plt.xlabel("x_test")
    plt.ylabel("temperature")
    plt.show()
実行ログ
・学習
1517910051.0
((106, 1), (106, 1))
((96, 1), (96, 1))
106
i=0, train acc, test acc | 1.0, 1.0 , loss=0.04343470078904482
('time : ', 0.004988908767700195)
i=200, train acc, test acc | 1.0, 1.0 , loss=0.0019784747520252997
('time : ', 0.037760019302368164)
i=400, train acc, test acc | 1.0, 1.0 , loss=0.0017000861910257533
('time : ', 0.06999611854553223)
i=600, train acc, test acc | 1.0, 1.0 , loss=0.0018671478595782493
('time : ', 0.10175895690917969)
i=800, train acc, test acc | 1.0, 1.0 , loss=0.0025957290751811744
('time : ', 0.13359308242797852)
i=1000, train acc, test acc | 1.0, 1.0 , loss=0.0021469629579090287
('time : ', 0.1651439666748047)
i=1200, train acc, test acc | 1.0, 1.0 , loss=0.0021951411047292646
('time : ', 0.19913506507873535)
i=1400, train acc, test acc | 1.0, 1.0 , loss=0.0017905553515502502
('time : ', 0.23587608337402344)
i=1600, train acc, test acc | 1.0, 1.0 , loss=0.003246984949423655
('time : ', 0.26787710189819336)
i=1800, train acc, test acc | 1.0, 1.0 , loss=0.0008185550884545171
('time : ', 0.29988908767700195)
i=2000, train acc, test acc | 1.0, 1.0 , loss=0.0007422158728507941
('time : ', 0.3315908908843994)
i=2200, train acc, test acc | 1.0, 1.0 , loss=0.002144580155490773
('time : ', 0.36358094215393066)
i=2400, train acc, test acc | 1.0, 1.0 , loss=0.0006523045260240316
('time : ', 0.39658689498901367)
i=2600, train acc, test acc | 1.0, 1.0 , loss=0.0007984398868557556
('time : ', 0.43489599227905273)
i=2800, train acc, test acc | 1.0, 1.0 , loss=0.0017546652891529933
('time : ', 0.4676520824432373)
train acc, test acc | 1.0, 1.0 , loss=0.0014729059300481405
('time : ', 0.4995899200439453)
Saved Network Parameters!
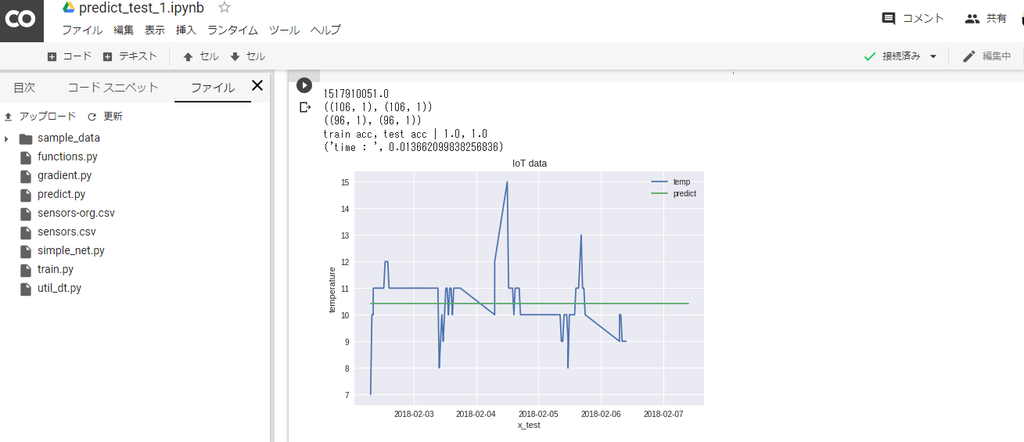
・評価
1517910051.0
((106, 1), (106, 1))
((96, 1), (96, 1))
train acc, test acc | 1.0, 1.0
('time : ', 0.013662099838256836)


