機械学習で、ロジスティック回帰 予測問題
index:
概要
前回の重回帰分析と異なり、
目的変数が、連続した値ではなく
予測したい変数が連続数値ではなく、2種類の選択(購入する /しない)の場合
を考えます。
環境
python 3.5
scikit-learn
numpy
matplotlib
参考の資料
東大さまの、データサイエンス資料を参考にしました。
http://weblab.t.u-tokyo.ac.jp/gci_contents/
学習データ
特定の人の、収入に関するデータ
目的変数:
その人の収入が50K(5万ドル)を超えるかどうか
の判定
説明変数:
年齢、職業、性別など
adult_data.info() で、中身をみておきます
<class 'pandas.core.frame.DataFrame'>
RangeIndex: 32561 entries, 0 to 32560
Data columns (total 15 columns):
age               32561 non-null int64
workclass         32561 non-null object
fnlwgt            32561 non-null int64
education         32561 non-null object
education-num     32561 non-null int64
marital-status    32561 non-null object
occupation        32561 non-null object
relationship      32561 non-null object
race              32561 non-null object
sex               32561 non-null object
capital-gain      32561 non-null int64
capital-loss      32561 non-null int64
hours-per-week    32561 non-null int64
native-country    32561 non-null object
flg-50K           32561 non-null object
dtypes: int64(6), object(9)
memory usage: 3.7+ MB
コード
データ読み込み、pandas
目的変数:flg立てをする
学習、
評価
・標準化 を、行った場合の例です
import numpy as np
import numpy.random as random
import scipy as sp
from pandas import Series, DataFrame
import pandas as pd

# 可視化モジュール
import matplotlib.pyplot as plt
import matplotlib as mpl
#%matplotlib inline
# 機械学習モジュール
import sklearn

# 標準化対応、学習。
# 学習データ
adult_data = pd.read_csv("dat_money.csv" )
print(adult_data.head( ))

#
adult_data.info()
#
adult_data.groupby("flg-50K").size()
#
# 目的変数:flg立てをする
adult_data["fin_flg"] = adult_data["flg-50K"].map(lambda x: 1 if x ==' >50K' else 0)

#
adult_data.groupby("fin_flg").size()

#
# ロジスティック回帰
from sklearn.linear_model import LogisticRegression
from sklearn.model_selection import train_test_split

# 標準化のためのモジュール
from sklearn.preprocessing import StandardScaler

# 説明変数と目的変数
X = adult_data[["age","fnlwgt","education-num","capital-gain","capital-loss"]]
Y = adult_data['fin_flg']

# 学習データとテストデータに分ける
X_train, X_test, y_train, y_test = train_test_split(X,Y,random_state=0)

# ロジスティック回帰
model = LogisticRegression()

# 標準化
sc = StandardScaler()
sc.fit(X_train)
X_train_std = sc.transform(X_train)
X_test_std  = sc.transform(X_test)

clf = model.fit(X_train_std,y_train)
print("train:",clf.score(X_train_std,y_train))
print("test:", clf.score(X_test_std,y_test))

print(clf.coef_ )
#
pred= model.predict(X_test_std[:10])
print(pred )
github
github.com
python3 です。
実行
テストデータは、80.9% 程の正解
となりました。
train: 0.810483210483
test: 0.809974204643
・先頭の数件テスト、収入判定/ 予測

機械学習で、重回帰分析(2) 家賃を予測する
index:
概要
前回の重回帰分析の続編とり、
家賃の予測機能を検証したいと、思います。
不動産の物件情報を学習し、特定の物件の家賃を予測
scikit-learn を使用
・前回と、機械学習の流れは同じで、学習データは、
今回は、家賃に関係するデータとなります
コード
csvデータを読み込み、学習
評価
import numpy as np
import numpy.random as random
import scipy as sp
from pandas import Series, DataFrame
import pandas as pd

# 可視化モジュール
import matplotlib.pyplot as plt
import matplotlib as mpl
import seaborn as sns
# 機械学習モジュール
import sklearn

#
# 学習データ
wdata = pd.read_csv("data.csv" )
#wdata.columns =["no","addr","price","siki_price", "rei_price" ,"menseki" ,"nensu" ,"toho" ,"madori" ,"houi" ,"kouzou" ]
wdata.columns =["no", "price","siki_price", "rei_price" ,"menseki" ,"nensu" ,"toho" ,"madori" ,"houi" ,"kouzou" ]
print(wdata.head() )
#print(wdata["NO"][: 10 ] )

# conv=> num
sub_data = wdata[[ "no","price","siki_price", "rei_price" ,"menseki" ,"nensu" ,"toho" ] ]
sub_data = sub_data.assign(price=pd.to_numeric( sub_data.price))

print(sub_data["price"][: 10])
##quit()

#
# データの分割(学習データとテストデータに分ける)
# sklearnのバージョンによっては train_test_splitはsklearn.cross_validationにしか入ってない場合があります
from sklearn.model_selection import train_test_split

# モデル
from sklearn import linear_model

# モデルのインスタンス
l_model = linear_model.LinearRegression()

# 説明変数に "price" 以外を利用
X = sub_data.drop("price", axis=1)

print(X.shape )
#print( type( X) )
#print(X[: 10 ] )
# 目的変数
Y = sub_data["price"]

# 学習データとテストデータに分ける
X_train, X_test, y_train, y_test = train_test_split(X, Y, test_size=0.25 ,random_state=0)
print(X_train.shape , y_train.shape  )
print(X_test.shape , y_test.shape  )
#print( type( X_test ) )
#quit()

# fit
clf = l_model.fit(X_train,y_train)
print("train:",clf.__class__.__name__ ,clf.score(X_train,y_train))
print("test:",clf.__class__.__name__ , clf.score(X_test,y_test))

# 偏回帰係数
print(pd.DataFrame({"Name":X.columns,
                    "Coefficients":clf.coef_}).sort_values(by='Coefficients') )

# 切片
print(clf.intercept_)
#quit()

#predict
#tdat =X_test[1: 2]
tdat =X_test[0: 5 ]
#print(tdat )
pred = l_model.predict(tdat )
#print(pred.shape )
print(pred )
評価
・テストデータの先頭の、数件の家賃(予測)
DataFrame

・テストデータ、予測(家賃)の比較 のグラフ

機械学習で、重回帰分析 予測問題
概要
重回帰分析で、複数の変数(説明変数)を含むデータ学習し、予測を出力する例をテストしてみました。
scikit-learn を使用
環境
python 3.5
scikit-learn
numpy
参考の資料
東大さまの、データサイエンス資料を参考にしました。
http://weblab.t.u-tokyo.ac.jp/gci_contents/
コード
csvデータ読み込み、(pandas )
学習データ、テストに分割
モデル定義> 学習
評価
import numpy as np
import numpy.random as random
import scipy as sp
from pandas import Series, DataFrame
import pandas as pd

# 可視化モジュール
import matplotlib.pyplot as plt
import matplotlib as mpl
import seaborn as sns
# 機械学習モジュール
import sklearn

#
# 学習データ
wdata = pd.read_csv("dat_weight.csv"
              ,names=("weight", "height","mid_lenght","top_lenth") )

#print(wdata.head() )
from sklearn.model_selection import train_test_split

# モデル
from sklearn import linear_model

# モデルのインスタンス
l_model = linear_model.LinearRegression()

# 説明変数に "xx" 以外を利用
X = wdata.drop("weight", axis=1)

print(X.shape )
#print(X[:10 ] )
#quit()
#print( type( X) )
#print(X[: 10 ] )

# 目的変数
Y = wdata["weight"]
# 学習データとテストデータに分ける
X_train, X_test, y_train, y_test = train_test_split(X, Y, test_size=0.25 ,random_state=0)
print(X_train.shape , y_train.shape  )
print(X_test.shape , y_test.shape  )
#print( type( X_test ) )
#quit()

# fit
clf = l_model.fit(X_train,y_train)
print("train:",clf.__class__.__name__ ,clf.score(X_train,y_train))
print("test:",clf.__class__.__name__ , clf.score(X_test,y_test))

# 偏回帰係数
print(pd.DataFrame({"Name":X.columns,
                    "Coefficients":clf.coef_}).sort_values(by='Coefficients') )

# 切片
print(clf.intercept_)
#quit()

#predict
#tdat =X_test[1: 2]
tdat =X_test[0: 5 ]
#print(tdat )
pred = l_model.predict(tdat )
#print(pred.shape )
print(pred )
#print(pred[: 10])
quit()
実行、評価
(50, 3)
(37, 3) (37,)
(13, 3) (13,)
train: LinearRegression 0.47236561361359364
test: LinearRegression 0.30795876365763886
   Coefficients        Name
1      0.125665  mid_lenght
2      0.187075   top_lenth
0      0.600082      height
-54.72694773189494
[69.36147445 74.09542963 80.6807738  74.09542963 70.03651743 70.94924446
 69.36147445 74.09542963 70.03651743 69.97216712]
データ件数が、少なかったり。
精度は、低めでした、
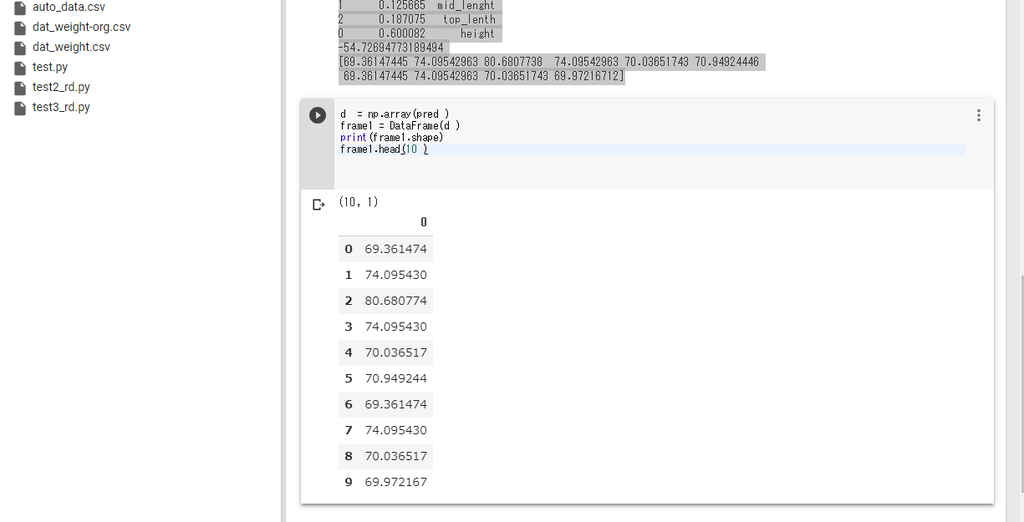
・テストデータの先頭の、N人の体重。
pd.DataFrame

ディープラーニングで、数値系予測 python版
index:
概要
ディープラーニングの、予測系問題として、温度値の数値予測を検討してみました。
python版で、フレームワークは使用しておりません。
設計については、書籍を参考にしていますので。オリジナル仕様ではありません。
参考の書籍
ゼロから作るDeep Learning /オライリー・ジャパン
ISBN978-4-87311-758-4
https://www.oreilly.co.jp/books/9784873117584/
=>基本的な部分かもしれませんが、勉強になりました。
コード
上記書籍の4章の、比較的シンプルな例を参考にしています
一部のコードのみですが、
興味のある方は、書籍を参考下さい(有償ですが。)
・train.py
学習、パラメータ保存
モデル、ニューロンの数
入力 : 1
隠れ層: 10
出力層 : 1
=> csvファイルから、データ読み込み、学習
# -*- coding: utf-8 -*-
# train/学習処理。結果ファイル保存。
# TwoLayerNet を参考に、3層ネットワーク利用
#  学習 >パラメータ保存

import numpy as np
import pandas as pd
from matplotlib import pyplot as plt
from simple_net import SimpleNet
from util_dt import *
import time

#
if __name__ == '__main__':
    # 学習データ
    rdDim = pd.read_csv("sensors.csv", names=('id', 'temp', 'time') )
    fDim = rdDim["temp"]
    #print(fDim[:10] )
    #quit()
    y_train = np.array(fDim, dtype = np.float32).reshape(len(fDim),1)
    x_train = conv_obj_dtArr(rdDim["time"] )
#    aa = add_date_arr(rdDim, 24 * 10 )
    #add N day
    x_test_pred = add_date_arr(rdDim["time"], 24 * 1 )
    n_train = int(len(x_train) * 0.1 )
    x_test = x_train[ n_train : ]
    y_test = y_train[ n_train : ]
#    x_test_pred =get_pred_dat(x_test, 30 )

    N= len(x_train)
    N_test  =len(x_test )
    num_max_y =100
    y_train =y_train / num_max_y
    y_test  =y_test / num_max_y
    print(x_train.shape, y_train.shape )
    print(x_test.shape  , y_test.shape )
    #quit()
    #
    network = SimpleNet(input_size=1 , hidden_size=10, output_size=1 )
    iters_num = 3000  # 繰り返しの回数を適宜設定する
    train_size = x_train.shape[0]
    print( train_size )
    #
    global_start_time = time.time()

#    batch_size = 100
    batch_size = 32
    learning_rate = 0.1

    train_loss_list = []
    train_acc_list = []
    test_acc_list = []

#    iter_per_epoch = max(train_size / batch_size, 1)
    iter_per_epoch =200
    #print(iter_per_epoch)
    #quit()

    for i in range(iters_num):
        batch_mask = np.random.choice(train_size, batch_size)
        x_batch = x_train[batch_mask]
        t_batch = y_train[batch_mask]

        # 勾配の計算
        grad = network.gradient(x_batch, t_batch)

        # パラメータの更新
        for key in ('W1', 'b1', 'W2', 'b2'):
            network.params[key] -= learning_rate * grad[key]

        loss = network.loss(x_batch, t_batch)
        train_loss_list.append(loss)

        if i % iter_per_epoch == 0:
            train_acc = network.accuracy(x_train, y_train)
            test_acc  = network.accuracy(x_test, y_test)
            train_acc_list.append(train_acc)
            test_acc_list.append(test_acc)
            print("i=" +str(i) + ", train acc, test acc | " + str(train_acc) + ", " + str(test_acc) + " , loss=" +str(loss) )
            print ('time : ', time.time() - global_start_time)
            #print("train acc, test acc | " + str(train_acc) + ", " + str(test_acc))
    #pred
    train_acc = network.accuracy(x_train, y_train)
    test_acc  = network.accuracy(x_test, y_test)
    #
    print("train acc, test acc | " + str(train_acc) + ", " + str(test_acc) + " , loss=" +str(loss) )
    print ('time : ', time.time() - global_start_time)
    #
    # パラメータの保存
    network.save_params("params.pkl")
    print("Saved Network Parameters!")
・評価
predict.py
# -*- coding: utf-8 -*-
# 評価
#

import numpy as np
import pandas as pd
from matplotlib import pyplot as plt
from simple_net import SimpleNet
from util_dt import *
import time
import pickle

#
if __name__ == '__main__':
    # 学習データ
    global_start_time = time.time()
    #
    rdDim = pd.read_csv("sensors.csv", names=('id', 'temp', 'time') )
    fDim = rdDim["temp"]
    y_train = np.array(fDim, dtype = np.float32).reshape(len(fDim),1)
    x_train = conv_obj_dtArr(rdDim["time"] )
    #add N day
    x_test_pred = add_date_arr(rdDim["time"], 24 * 1 )
    n_train = int(len(x_train) * 0.1 )
    x_test = x_train[ n_train : ]
    y_test = y_train[ n_train : ]
    N= len(x_train)
    N_test  =len(x_test )
    num_max_y =100
    y_train =y_train / num_max_y
    y_test  =y_test / num_max_y
    print(x_train.shape, y_train.shape )
    print(x_test.shape  , y_test.shape )
    # load
    network = SimpleNet(input_size=1 , hidden_size=10, output_size=1 )
    network.load_params("params.pkl" )
    #print( network.params["W1"] )
    #pred
    train_acc = network.accuracy(x_train, y_train)
    test_acc  = network.accuracy(x_test, y_test)
    #
    print("train acc, test acc | " + str(train_acc) + ", " + str(test_acc)   )
    #
    x_test_dt= conv_num_date(x_test_pred )
    x_train_dt= conv_num_date(x_train )
    #print(x_test_dt.shape )
    y_val = network.predict(x_test_pred )
    y_train = y_train * num_max_y
    y_val   = y_val * num_max_y
    print ('time : ', time.time() - global_start_time)
    #print(y_val[:10] )
    #print(x_test_dt[:10] )
    #quit()
    #plt
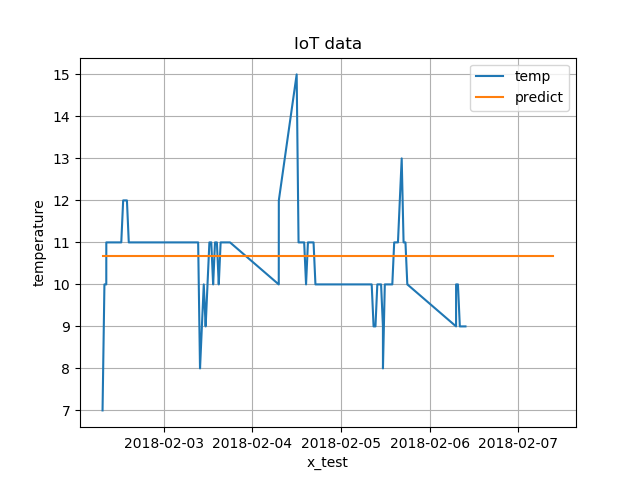
    plt.plot(x_train_dt, y_train, label = "temp")
    plt.plot(x_test_dt , y_val , label = "predict")
    plt.legend()
    plt.grid(True)
    plt.title("IoT data")
    plt.xlabel("x_test")
    plt.ylabel("temperature")
    plt.show()
実行ログ
・学習
1517910051.0
((106, 1), (106, 1))
((96, 1), (96, 1))
106
i=0, train acc, test acc | 1.0, 1.0 , loss=0.04343470078904482
('time : ', 0.004988908767700195)
i=200, train acc, test acc | 1.0, 1.0 , loss=0.0019784747520252997
('time : ', 0.037760019302368164)
i=400, train acc, test acc | 1.0, 1.0 , loss=0.0017000861910257533
('time : ', 0.06999611854553223)
i=600, train acc, test acc | 1.0, 1.0 , loss=0.0018671478595782493
('time : ', 0.10175895690917969)
i=800, train acc, test acc | 1.0, 1.0 , loss=0.0025957290751811744
('time : ', 0.13359308242797852)
i=1000, train acc, test acc | 1.0, 1.0 , loss=0.0021469629579090287
('time : ', 0.1651439666748047)
i=1200, train acc, test acc | 1.0, 1.0 , loss=0.0021951411047292646
('time : ', 0.19913506507873535)
i=1400, train acc, test acc | 1.0, 1.0 , loss=0.0017905553515502502
('time : ', 0.23587608337402344)
i=1600, train acc, test acc | 1.0, 1.0 , loss=0.003246984949423655
('time : ', 0.26787710189819336)
i=1800, train acc, test acc | 1.0, 1.0 , loss=0.0008185550884545171
('time : ', 0.29988908767700195)
i=2000, train acc, test acc | 1.0, 1.0 , loss=0.0007422158728507941
('time : ', 0.3315908908843994)
i=2200, train acc, test acc | 1.0, 1.0 , loss=0.002144580155490773
('time : ', 0.36358094215393066)
i=2400, train acc, test acc | 1.0, 1.0 , loss=0.0006523045260240316
('time : ', 0.39658689498901367)
i=2600, train acc, test acc | 1.0, 1.0 , loss=0.0007984398868557556
('time : ', 0.43489599227905273)
i=2800, train acc, test acc | 1.0, 1.0 , loss=0.0017546652891529933
('time : ', 0.4676520824432373)
train acc, test acc | 1.0, 1.0 , loss=0.0014729059300481405
('time : ', 0.4995899200439453)
Saved Network Parameters!
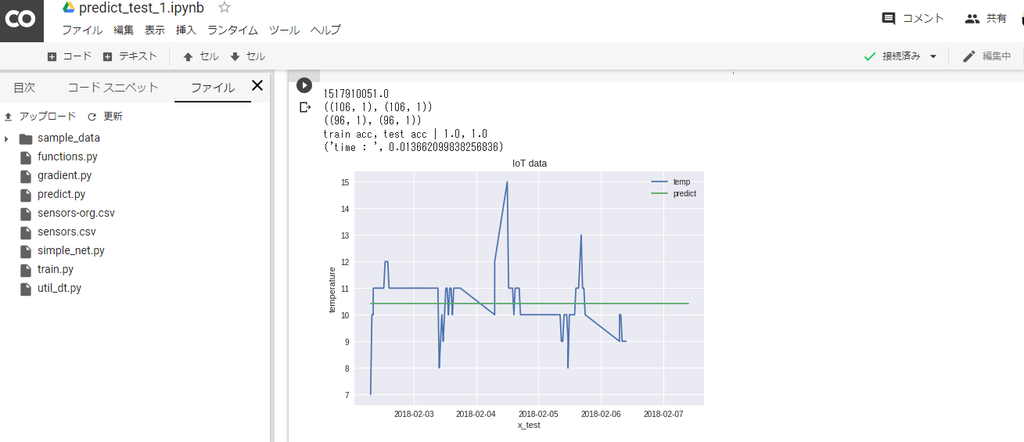
・評価
1517910051.0
((106, 1), (106, 1))
((96, 1), (96, 1))
train acc, test acc | 1.0, 1.0
('time : ', 0.013662099838256836)
ディープラーニングで画像認識 実装(4)、keras CNNで、自前準備した画像の学習(2)
index:
概要
前回は、自前で準備した画像で、ImageDataGenerator flow_from_directory()
を使用して、学習用/ 評価用データを準備しましたが。
評価時の、正解率などが。よく把握できなかったので
画像読み込み処理を含めて、全面的に再作成しました。
今回も、画像データの学習に時間がかかったので
google colabを、使用させて頂きました。(作業pcと比較して、かなり高速でした)
環境
keras : 2.1.3
tensorflow : 1.4
python : 3.5.2
画像データ
フォルダ構成は、前回と同じ
data フォルダ下に配置
train : 学習用
validation : 検証用
を作成し、
各フォルダの下に、
各クラス単位のフォルダ、その下に、学習用の画像を配置
・前処理は、前回と同じ手法で
train 下に、水増し画像を多目に作成しておきます。
C:\tmp\2017_tmp\python35\tensorflow\img_data_test>tree data
フォルダー パスの一覧:  ボリューム Acer
ボリューム シリアル番号は 7221-E6BF です
C:\TMP\2017_TMP\PYTHON35\TENSORFLOW\IMG_DATA_TEST\DATA
├─train
│  ├─bird
│  ├─cat
│  ├─dog
│  └─flower
└─validation
    ├─bird
    ├─cat
    ├─dog
    └─flower
コード
https://github.com/kuc-arc-f/img_data_test2
・img_loader.py
data/train , validation の下層
のフォルダを、クラスとして生成し、
画像データは、numpy arrayに変換します。
・train.py
keras のNN で学習、
モデルで、ニューロン数は
入力: 128 * 128 * 3
隠れ層: 64
出力層: クラスの数
・エポック数は,30~40 で、
正解率は、95%以上まで上昇できました。
#モデルを構築
model=Sequential()

model.add(Conv2D(32,(3,3),padding='same',input_shape=(128, 128,3)))
model.add(Activation('relu'))
model.add(Conv2D(32,(3,3),padding='same'))
model.add(Activation('relu'))
model.add(MaxPool2D(pool_size=(2,2)))
model.add(Dropout(0.25))

model.add(Conv2D(64,(3,3),padding='same'))
model.add(Activation('relu'))
model.add(Conv2D(64,(3,3),padding='same'))
model.add(Activation('relu'))
model.add(MaxPool2D(pool_size=(2,2)))
model.add(Dropout(0.25))

model.add(Flatten())
model.add(Dense(512))
model.add(Activation('relu'))
model.add(Dropout(0.5))
model.add(Dense( num_classes ,activation='softmax'))

model.compile(optimizer='adam',loss='categorical_crossentropy',metrics=['accuracy'])

batch_size=32
epoch_num=20
#fit
history=model.fit(x_train,y_train
    ,batch_size=batch_size
    ,nb_epoch=epoch_num
    ,verbose=1,validation_split=0.1)
・評価
predict.py
    # モデルの評価
    loss, acc = model.evaluate(x_test, y_test, verbose=0)
    print('Test loss:', loss)
    print('Test acc:', acc)
    print("#end_acc")
実行ログ
・学習、エポック=30
((264, 128, 128, 3), (264,))
((24, 128, 128, 3), (24,))
dog
24
/usr/local/lib/python2.7/dist-packages/ipykernel_launcher.py:70: UserWarning: The `nb_epoch` argument in `fit` has been renamed `epochs`.
Train on 237 samples, validate on 27 samples
Epoch 1/30
237/237 [==============================] - 3s 12ms/step - loss: 2.4715 - acc: 0.3291 - val_loss: 1.7619 - val_acc: 0.0000e+00
Epoch 2/30
237/237 [==============================] - 1s 4ms/step - loss: 1.2486 - acc: 0.4177 - val_loss: 1.3408 - val_acc: 0.0000e+00
Epoch 3/30
237/237 [==============================] - 1s 4ms/step - loss: 1.0142 - acc: 0.4852 - val_loss: 1.6289 - val_acc: 0.0741
Epoch 4/30
237/237 [==============================] - 1s 4ms/step - loss: 0.7425 - acc: 0.6667 - val_loss: 1.0257 - val_acc: 0.3333
Epoch 5/30
237/237 [==============================] - 1s 4ms/step - loss: 0.4779 - acc: 0.8354 - val_loss: 1.0483 - val_acc: 0.4815
Epoch 6/30
237/237 [==============================] - 1s 4ms/step - loss: 0.2758 - acc: 0.8945 - val_loss: 0.8937 - val_acc: 0.7037
Epoch 7/30
237/237 [==============================] - 1s 4ms/step - loss: 0.3764 - acc: 0.8354 - val_loss: 0.4036 - val_acc: 0.8519
Epoch 8/30
237/237 [==============================] - 1s 4ms/step - loss: 0.2776 - acc: 0.8903 - val_loss: 0.4373 - val_acc: 0.7778
Epoch 9/30
237/237 [==============================] - 1s 4ms/step - loss: 0.2141 - acc: 0.9367 - val_loss: 0.5481 - val_acc: 0.8148
Epoch 10/30
237/237 [==============================] - 1s 4ms/step - loss: 0.2487 - acc: 0.8987 - val_loss: 0.6807 - val_acc: 0.7778
Epoch 11/30
237/237 [==============================] - 1s 4ms/step - loss: 0.2253 - acc: 0.9030 - val_loss: 0.4038 - val_acc: 0.8148
Epoch 12/30
237/237 [==============================] - 1s 4ms/step - loss: 0.0826 - acc: 0.9831 - val_loss: 0.8256 - val_acc: 0.7407
Epoch 13/30
237/237 [==============================] - 1s 4ms/step - loss: 0.0598 - acc: 0.9747 - val_loss: 1.3040 - val_acc: 0.5556
Epoch 14/30
237/237 [==============================] - 1s 4ms/step - loss: 0.0431 - acc: 0.9831 - val_loss: 0.6250 - val_acc: 0.7778
Epoch 15/30
237/237 [==============================] - 1s 4ms/step - loss: 0.3783 - acc: 0.8945 - val_loss: 2.8109 - val_acc: 0.1852
Epoch 16/30
237/237 [==============================] - 1s 4ms/step - loss: 0.3372 - acc: 0.9030 - val_loss: 0.4436 - val_acc: 0.8889
Epoch 17/30
237/237 [==============================] - 1s 4ms/step - loss: 0.0945 - acc: 1.0000 - val_loss: 0.9048 - val_acc: 0.6296
Epoch 18/30
237/237 [==============================] - 1s 4ms/step - loss: 0.0356 - acc: 0.9958 - val_loss: 0.5516 - val_acc: 0.7407
Epoch 19/30
237/237 [==============================] - 1s 4ms/step - loss: 0.0263 - acc: 0.9916 - val_loss: 0.3969 - val_acc: 0.8148
Epoch 20/30
237/237 [==============================] - 1s 4ms/step - loss: 0.0127 - acc: 0.9958 - val_loss: 0.5036 - val_acc: 0.8148
Epoch 21/30
237/237 [==============================] - 1s 4ms/step - loss: 0.0073 - acc: 0.9958 - val_loss: 0.5929 - val_acc: 0.8148
Epoch 22/30
237/237 [==============================] - 1s 4ms/step - loss: 0.0123 - acc: 0.9958 - val_loss: 0.5014 - val_acc: 0.8519
Epoch 23/30
237/237 [==============================] - 1s 4ms/step - loss: 0.0783 - acc: 0.9958 - val_loss: 0.3049 - val_acc: 0.8889
Epoch 24/30
237/237 [==============================] - 1s 4ms/step - loss: 0.0062 - acc: 1.0000 - val_loss: 0.7293 - val_acc: 0.8519
Epoch 25/30
237/237 [==============================] - 1s 4ms/step - loss: 0.0058 - acc: 1.0000 - val_loss: 0.6191 - val_acc: 0.8148
Epoch 26/30
237/237 [==============================] - 1s 4ms/step - loss: 0.0049 - acc: 1.0000 - val_loss: 0.4268 - val_acc: 0.8519
Epoch 27/30
237/237 [==============================] - 1s 4ms/step - loss: 0.0056 - acc: 1.0000 - val_loss: 0.3985 - val_acc: 0.8889
Epoch 28/30
237/237 [==============================] - 1s 4ms/step - loss: 0.0011 - acc: 1.0000 - val_loss: 0.5152 - val_acc: 0.8889
Epoch 29/30
237/237 [==============================] - 1s 4ms/step - loss: 0.0714 - acc: 0.9958 - val_loss: 0.6255 - val_acc: 0.8519
Epoch 30/30
237/237 [==============================] - 1s 4ms/step - loss: 0.0013 - acc: 1.0000 - val_loss: 0.7043 - val_acc: 0.7778
・評価
正解: 約 95.83%
('Test loss:', 0.04905049502849579)
('Test acc:', 0.9583333134651184)
ディープラーニングで画像認識 実装(3)、keras で、CIFAR-10データの学習
index:
概要
前回は、自前で準備した画像の
keras で画像認識の学習、評価、を行いました。
mnist以外のデータで、CIFAR-10データ を試してみたいと思います
環境
keras : 2.1.3
tensorflow : 1.4
python : 3.5.2
画像データ
kerasの場合、cifar10関連の処理を読み込むと、
カンタンに、学習用データとしてロード可能でした。
下記の import
from keras.datasets import cifar10
50000 枚が学習用、残り 10000 枚が評価用
画素数 32x32 で RGB

・画像が小さく、画素数が少ない為。
種類によっては、人が見てもよく判別できない物もありそうです
・種類は、10種類で下記内容
airplane; 飛行機
automobile; 自動車
bird; 鳥
cat; 猫
deer; 鹿
dog; 犬
frog; 蛙
horse; 馬
ship; 船, 舟
truck; 大型トラック
コード
https://github.com/kuc-arc-f/img_CIFAR
・今回は、開発PCで処理時間が長くなりそうで、
google colabで、学習処理を行いました。
train_colab.py
・ データのロード
if __name__ == '__main__':
    #cifar10をダウンロード
    (x_train,y_train),(x_test,y_test)=cifar10.load_data()
    #
    print(x_train.shape, y_train.shape )
    print(x_test.shape  , y_test.shape )
    #画像を0-1の範囲で正規化
    x_train=x_train.astype('float32')/255.0
    x_test=x_test.astype('float32')/255.0

    #正解ラベルをOne-Hot表現に変換
    y_train=np_utils.to_categorical(y_train,10)
    y_test=np_utils.to_categorical(y_test,10)
・学習の処理
batch_size=32
epoch_num=10
#fit
history=model.fit(x_train,y_train
    ,batch_size=batch_size
    ,nb_epoch=epoch_num
    ,verbose=1,validation_split=0.1)
・ 実行ログ
Using TensorFlow backend.
((50000, 32, 32, 3), (50000, 1))
((10000, 32, 32, 3), (10000, 1))
/usr/local/lib/python2.7/dist-packages/ipykernel_launcher.py:62: UserWarning: The `nb_epoch` argument in `fit` has been renamed `epochs`.
Train on 45000 samples, validate on 5000 samples
Epoch 1/10
45000/45000 [==============================] - 26s 578us/step - loss: 1.4947 - acc: 0.4553 - val_loss: 1.0340 - val_acc: 0.6320
Epoch 2/10
45000/45000 [==============================] - 22s 490us/step - loss: 1.0413 - acc: 0.6291 - val_loss: 0.8798 - val_acc: 0.6878
Epoch 3/10
45000/45000 [==============================] - 22s 495us/step - loss: 0.8964 - acc: 0.6855 - val_loss: 0.7888 - val_acc: 0.7224
Epoch 4/10
45000/45000 [==============================] - 22s 492us/step - loss: 0.8000 - acc: 0.7178 - val_loss: 0.7154 - val_acc: 0.7528
Epoch 5/10
45000/45000 [==============================] - 22s 489us/step - loss: 0.7319 - acc: 0.7452 - val_loss: 0.6705 - val_acc: 0.7704
Epoch 6/10
45000/45000 [==============================] - 22s 494us/step - loss: 0.6809 - acc: 0.7605 - val_loss: 0.6391 - val_acc: 0.7810
Epoch 7/10
45000/45000 [==============================] - 22s 490us/step - loss: 0.6376 - acc: 0.7781 - val_loss: 0.6564 - val_acc: 0.7762
Epoch 8/10
45000/45000 [==============================] - 22s 490us/step - loss: 0.6069 - acc: 0.7881 - val_loss: 0.6671 - val_acc: 0.7802
Epoch 9/10
45000/45000 [==============================] - 22s 496us/step - loss: 0.5759 - acc: 0.7948 - val_loss: 0.6474 - val_acc: 0.7846
Epoch 10/10
45000/45000 [==============================] - 22s 489us/step - loss: 0.5380 - acc: 0.8104 - val_loss: 0.6407 - val_acc: 0.7904
('Test loss:', 0.6536725306987763)
('Test acc:', 0.7773)
評価の、正解率は、 約77%で、いまいちな結果に。
エポック数は、10で少なめです。(GPUでも、数分かかりましたが。)
精度をあげるには、エポック数を増やしたり、
他の、パラメータ変更の必用がありそうですが
試行錯誤したいと思います。
・保存済みの学習ファイル、モデルのロードと、
評価の処理
predict.py
=> 学習時に、保存したファイルをロード、その後に、評価
    model_file = "cifar10_cnn.json"
    with open(model_file, 'r') as fp:
        model = model_from_json(fp.read())
    model.load_weights("cifar10_cnn.h5")
    model.compile(optimizer='adam',loss='categorical_crossentropy',metrics=['accuracy'])
#    model.summary()

    # モデルの評価
    loss, acc = model.evaluate(x_test, y_test, verbose=0)
    print('Test loss:', loss)
    print('Test acc:', acc)
関連
KerasでCIFAR-10の一般物体認識
http://aidiary.hatenablog.com/entry/20161127/1480240182
http://kikei.github.io/ai/2018/03/25/cifer10-cnn1.html
cifar10とKerasを使ってCNN(Convolutional Neural Network)を実装してみる
https://qiita.com/God_KonaBanana/items/10fa8bb58cdd1dbd2e59
ディープラーニングで画像認識 実装(2)、画像の前処理
index:
概要
前回は、keras で画像認識の学習、検証(画像認識の判定結果出力)等、
一連の流れを記載しましたが。
ディープラーニングで画像認識で、認識精度を向上させる為に、
学習画像数を増やしたり、前処理での作業を追加する場合がありそうですので、
ImageDataGeneratorを使用して、前処理(画像の水増し)を実施する内容です
・水増し処理なしで、十分な画像を準備できて、
認識精度も予想値以上に、向上している場合は。
不要な処理になりそうですので、精度向上面等で必用な場合は参考頂ければ
と思います。
環境
keras : 2.1.3
tensorflow : 1.4
python : 3.5.2
コード
前回のpushに含まれていますが。
before_proc.py
https://github.com/kuc-arc-f/img_data_test/blob/master/before_proc.py
・ImageDataGenerator の定義、
元の画像の指定(水増しする元画像)
#
datagen = ImageDataGenerator(
        rotation_range=40,
        width_shift_range=0.2,
        height_shift_range=0.2,
        shear_range=0.2,
        zoom_range=0.2,
        horizontal_flip=True,
        fill_mode='nearest')

img = load_img('neko_13.jpg')
.flow を使用して、ループ処理
指定回数で、処理を抜けます
save_to_dir: 保存先のフォルダ
save_prefix: ヘッダ文字
#
img_num = 20
i = 0
#for batch in datagen.flow(x, batch_size=1,
#                          save_to_dir='preview', save_prefix='tori', save_format='jpg'):
for batch in datagen.flow(x, batch_size=1,
                          save_to_dir='data/train/cat', save_prefix='neko_13', save_format='jpg'):

    i += 1
    if i > img_num:
        break
実行結果

水増し画像が追加されました。
前回の、画像の学習用データも。
同様の手法で作成した形となります
まとめ
上記の画像処理も、比較的カンタンに実装できて
kerase ImageDataGeneratorを使うと、前処理含めて
画像の学習処理ができそうです。


